
What is the CCI? versatile momentum-based oscillator developed
The Commodity Channel Index (CCI) is a versatile momentum-based oscillator developed by Donald Lambert in 1980. Originally designed for commodity trading, the CCI has proven equally effective across various financial markets including stocks, forex, and cryptocurrencies.
The CCI measures the current price level relative to an average price level over a specified period. When the CCI is high, it indicates that prices are well above their average, suggesting potential overbought conditions. Conversely, when the CCI is low, prices are well below their average, potentially indicating oversold conditions.
| Type | Size |
| Standard Lot | 100,000 units of base currency |
| Mini Lot | 10,000 units |
| Micro Lot | 1,000 units |
Applying the CCI in Trading ers employ when using the CCI indicator
There are several popular strategies traders employ when using the CCI indicator. The CCI typically oscillates between +100 and -100. Readings above +100 may signal overbought conditions, while readings below -100 may indicate oversold conditions.
Divergence trading involves looking for situations where price makes new highs or lows while the CCI fails to confirm, potentially signaling a reversal. Zero-line crossovers offer another approach—when CCI crosses above zero, it may suggest bullish momentum, while crossing below zero may indicate bearish momentum.
CCI Formula and Calculation
The CCI is calculated using the following steps: First, compute the Typical Price (TP) as the average of high, low, and close prices. Then, calculate the Simple Moving Average of the Typical Price over your chosen period. Finally, derive the Mean Deviation and apply the CCI formula.
The formula divides the difference between the Typical Price and its moving average by a constant multiplied by the Mean Deviation. This normalization ensures that approximately 70-80% of CCI values fall between -100 and +100.
Trading Strategies
Many traders use the +100/-100 levels as entry and exit signals. When CCI moves above +100, it signals strong upward momentum, and traders might consider long positions. When it falls below -100, it indicates strong downward momentum, potentially signaling short opportunities.
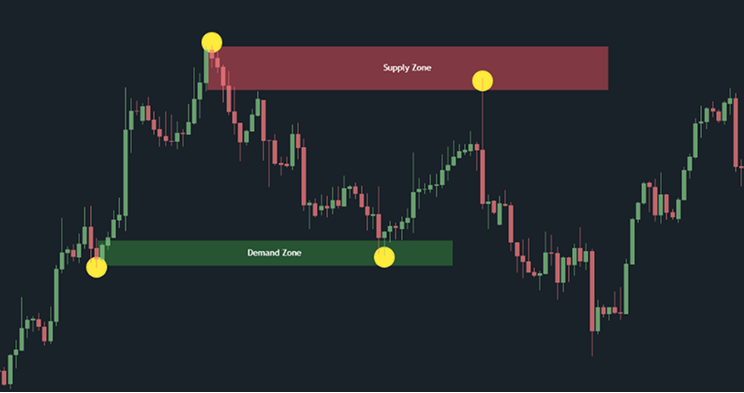
Another effective strategy combines CCI with support and resistance levels. When price approaches a support level and CCI shows oversold readings below -100, it may present a buying opportunity. Similarly, resistance levels combined with overbought CCI readings above +100 might signal selling opportunities.
Common Mistakes
One of the most common mistakes traders make is relying solely on the CCI without considering other factors. The CCI, like all technical indicators, should not be used in isolation. Market context, price action, and volume should all be considered alongside CCI readings.
Another mistake is assuming that overbought always means "sell" and oversold always means "buy." In strong trending markets, the CCI can remain in overbought or oversold territory for extended periods. This is why confirmation from other indicators is crucial.
Best Practices
For optimal results, consider combining CCI with other technical indicators such as moving averages or support/resistance levels. This multi-indicator approach helps filter out false signals and provides stronger confirmation for trading decisions.
Always use proper risk management techniques. Set stop-loss orders to protect your capital, and never risk more than a small percentage of your trading account on a single trade. The CCI is a powerful tool, but it works best when integrated into a comprehensive trading strategy.
Finally, practice using the CCI on historical data before applying it to live trading. This allows you to understand its behavior in different market conditions and develop confidence in interpreting its signals.




 Join Discord